Monitoring Your Applications
Monitor your application resources use
You can have an overview of the different resources consumed by the applications running in your project by going to the Monitoring tab (in the developer view)
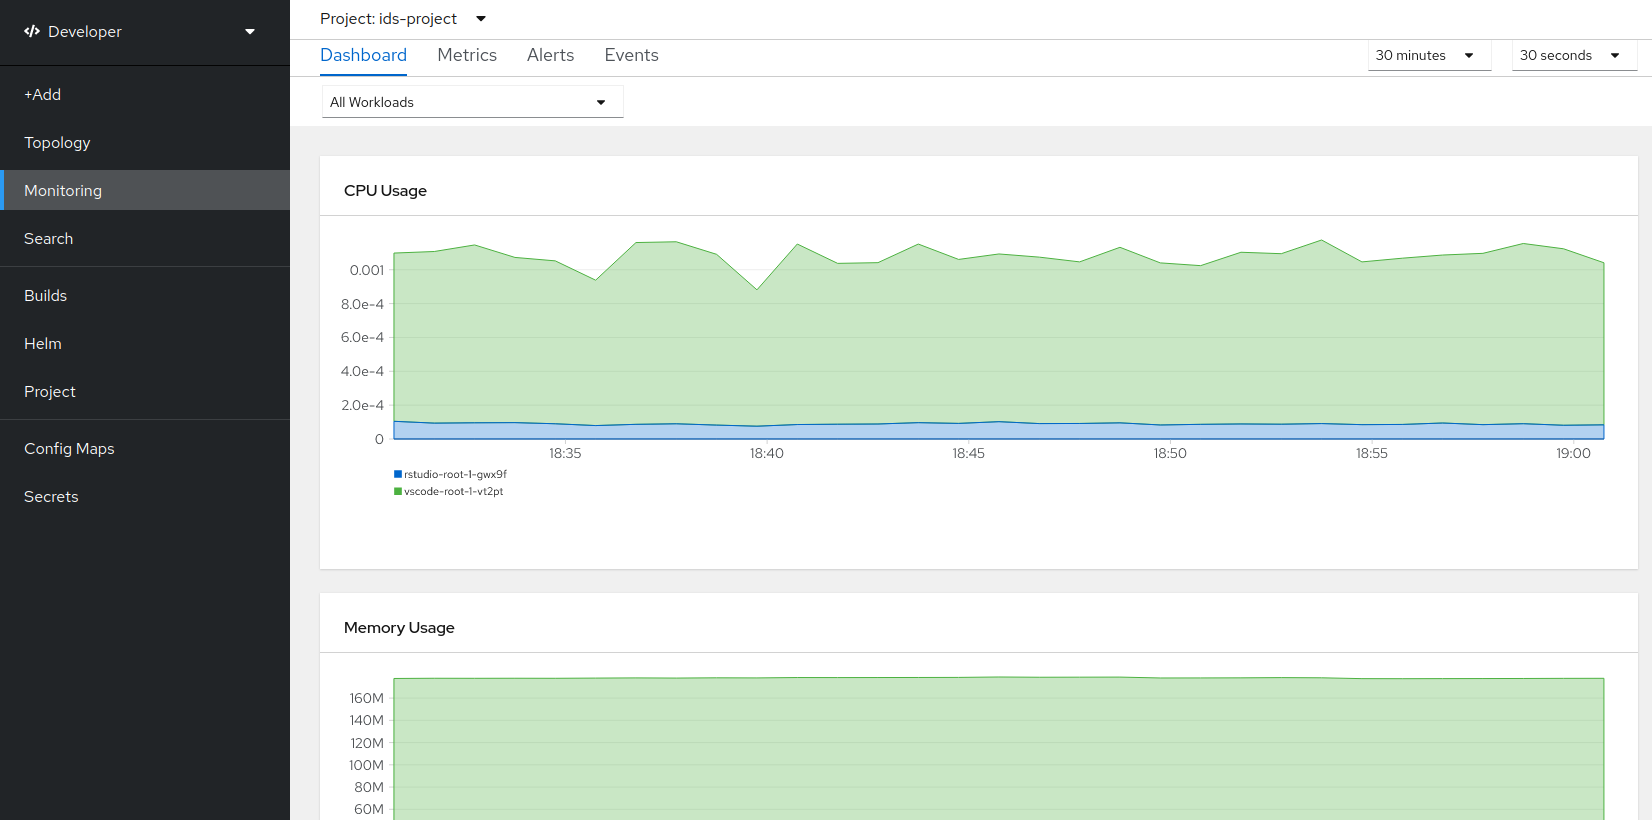
You can also check the CPU and memory usage directly from the terminal inside a specific container
Go to your application terminal, and run:
topCheck the number of Cpu(s) used at the top:
%Cpu(s): 3,3 us,
Check the memory usage with the
usedcolumn:MiB Mem : 515543.2 total, 403486.8 free, 98612.0 used, 13444.5 buff/cache
Debug an application deployment
If your application is facing issues when deployed:
- If the pod is not building, or not deploying properly, take a look at the Events tab of the deployment. It shows a log of all events faced by the deployment (assign to node, pull image, build, etc). Additionally, all Events in your project can be accessed in Monitoring.
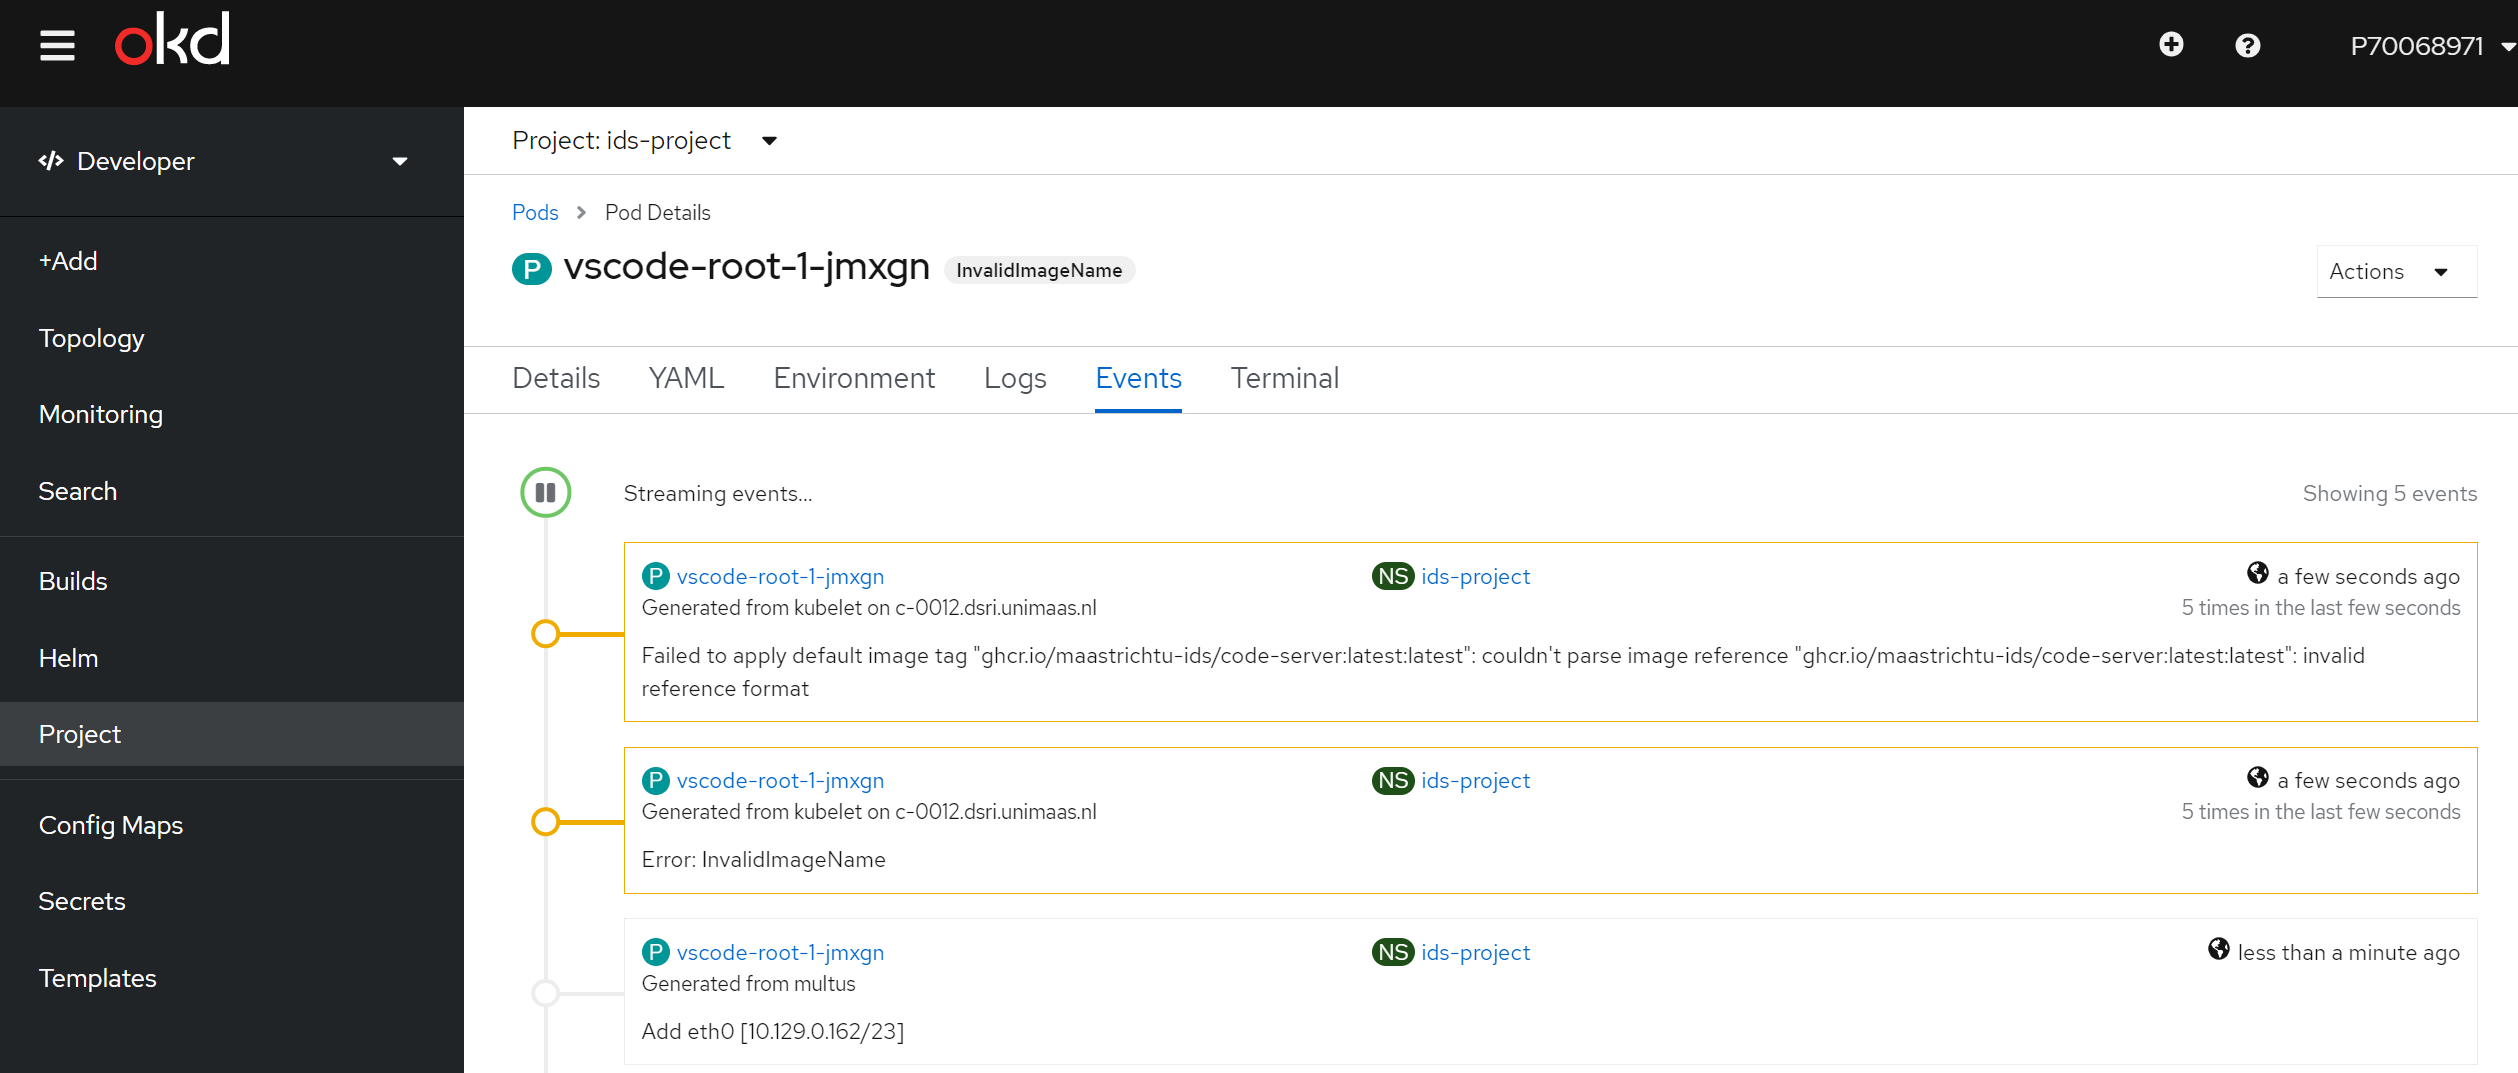
Various ways to check the events
You can also check the Monitoring page in the left side menu to see all events in a project.
Or use the terminal:
oc get events
- When a pod is running you can check its logs in the Logs tab (after going to the pod page). It will show the logs output of the container, equivalent to doing
docker logs.
Get help
If you cannot figure out the issue by yourself:
- Gather relevant information to help the RCS team to solve your issue: URL to the faulty application, which error was shown in the Events tab? Or in the Logs tab?
- Seek help using the Topdesk Form
- Checkout if an issue have already been created for this problem, or create a new one: https://github.com/MaastrichtU-IDS/dsri-documentation/issues